HS-LS2-2. Use mathematical representations to support and revise explanations based on evidence about factors affecting biodiversity and populations in ecosystems of different scales.
Biodiversity refers to the variety of life in a particular ecosystem, including the range of species, genetic differences, and ecosystems themselves. Populations within these ecosystems are influenced by various factors that can increase or decrease biodiversity. Understanding these factors is crucial for maintaining healthy ecosystems. In this review, we will explore how mathematical representations can be used to analyze and explain the factors that impact biodiversity and populations at different scales.
Main Concepts
Biodiversity: Biodiversity is the variety of all life forms on Earth, including the diversity within species, between species, and of ecosystems. High biodiversity generally indicates a healthy and resilient ecosystem.
Factors Affecting Biodiversity: Several factors can affect biodiversity, including habitat destruction, climate change, pollution, invasive species, and overexploitation of resources. These factors can lead to a decline in the number of species and the overall health of ecosystems.
Population Dynamics: Population dynamics refer to the changes in the number and composition of species populations in an ecosystem over time. Factors such as birth rates, death rates, immigration, and emigration all influence population dynamics.
Mathematical Representations: Mathematical representations, such as graphs, charts, and data analysis, are used to support and revise explanations about factors affecting biodiversity and populations. These tools help scientists identify trends, compare different data sets, and make predictions about future changes in ecosystems.
Analyzing Trends: By analyzing trends in data, such as population sizes over time or changes in species diversity, scientists can determine the health of an ecosystem and identify the impact of different factors. For example, a declining trend in species numbers could indicate habitat loss or environmental stress.
Graphical Comparisons: Graphical comparisons allow for the visualization of multiple data sets, making it easier to see relationships between different variables. For instance, a graph comparing pollution levels with species diversity can show how pollution affects biodiversity.
NGSS Aligned Testing Question
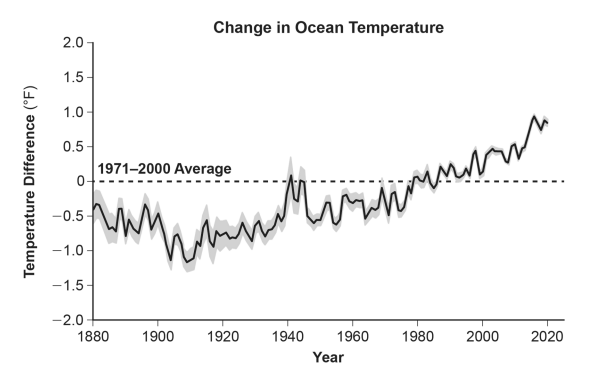
One potential source of stress on coral reefs is atmospheric carbon dioxide, which dissolves in the seawater forming carbonic acid. When excess carbon dioxide is present, it changes the acidity of ocean water and the availability of calcium carbonate for organisms to build and maintain their shells, skeletons, and other calcium carbonate-based structures. Research shows that another stressor is the current trend of the large-scale temperature change in oceans. This causes the zooxanthellae to either leave or be ejected from the coral polyps. The graphs below show changes in ocean conditions over the past century.
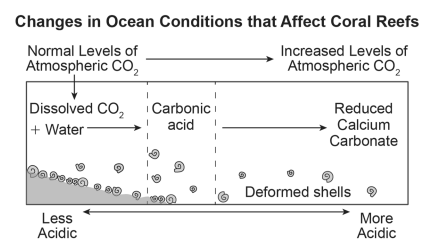
| Which claim best explains how continued changes in ocean acidity would affect the stability of the coral reef ecosystem? | |
|---|---|
| 1 | Decreasing dissolved carbon dioxide will decrease the acidity of oceans and cause ocean water to warm. |
| 2 | As the acidity of the oceans increases, the coral polyps will not have enough calcium carbonate to form their skeletons. |
| 3 | Ocean acidification will reverse the effects of ocean warming and contribute to stabilizing the coral reef ecosystem. |
| 4 | The coral polyps will need to adapt to the decreasing acidity and find a different substance to form their skeleton. |
Review Questions and Answers
- What is biodiversity?
- What are some factors that can affect biodiversity?
- How do population dynamics influence ecosystems?
- Why are mathematical representations important in studying ecosystems?
- What can analyzing trends in population data reveal?
- How can graphical comparisons help in understanding biodiversity?
- What might a declining trend in species numbers indicate?
- How can data analysis support explanations about ecosystem changes?
- Why is it important to consider multiple scales when studying ecosystems?
- What role do invasive species play in affecting biodiversity?
Biodiversity is the variety of all life forms on Earth, including the diversity within species, between species, and of ecosystems.
Factors that can affect biodiversity include habitat destruction, climate change, pollution, invasive species, and overexploitation of resources.
Population dynamics, which involve changes in the number and composition of species populations, influence ecosystems by affecting the balance of species and the availability of resources.
Mathematical representations are important because they help scientists analyze data, identify trends, and make informed predictions about factors affecting biodiversity and populations in ecosystems.
Analyzing trends in population data can reveal changes in species numbers over time, indicating factors such as environmental stress or successful conservation efforts.
Graphical comparisons allow scientists to visualize relationships between different variables, such as the impact of pollution on species diversity, helping to understand the factors influencing biodiversity.
A declining trend in species numbers might indicate habitat loss, environmental stress, or other negative factors affecting the ecosystem.
Data analysis supports explanations by providing evidence of how different factors affect populations and biodiversity, allowing scientists to make accurate predictions and informed decisions.
It is important to consider multiple scales because factors affecting ecosystems can have different impacts at local, regional, and global levels, influencing the overall biodiversity and health of the planet.
Invasive species can negatively affect biodiversity by outcompeting native species for resources, leading to a decline in native populations and altering the ecosystem balance.
*continue your studies by accessing another review sheet below*
HS. Structure and Function: HS-LS1-1 : HS-LS1-2 : HS-LS1-3
HS. Matter and Energy in Organisms and Ecosystems: HS-LS1-5 : HS-LS1-6 : HS-LS1-7 : HS-LS2-3 : HS-LS2-4 : HS-LS2-5
HS. Interdependent Relationships in Ecosystems: HS-LS2-1 : HS-LS2-2 : HS-LS2-6 : HS-LS2-7 : HS-LS2-8
HS. Inheritance and Variation of Traits: HS-LS1-4 : HS-LS3-1 : HS-LS3-2 : HS-LS3-3 : HS-LS1-8
HS. Natural Selection and Evolution: HS-LS4-1 : HS-LS4-2 : HS-LS4-3 : HS-LS4-4 : HS-LS4-5
Disclaimer: The information provided is intended to serve as a study guide based on a contextual analysis of the NGSS standards for the Life Science Biology assessment. These study guides should be used as a supplement to your overall study strategy, and their alignment to the actual test format is not guaranteed. We recommend that you consult with your instructor for additional guidance on exam preparation.